PepsiCo Earnings October 2024

Unlocking PepsiCo’s Potential: Earnings Insight & Technical Analysis

As PepsiCo, Inc. (PEP) gears up to announce its earnings on October 8, 2024, investors and traders are keenly watching. With the market opening, all eyes are on whether PepsiCo will meet or exceed the consensus earnings per share (EPS) estimate of US$2.30, up from last year’s US$2.25 for the same fiscal quarter.

Unlocking PepsiCo's Potential: Earnings Insight & Technical Analysis

Navigating the Ichimoku Cloud:

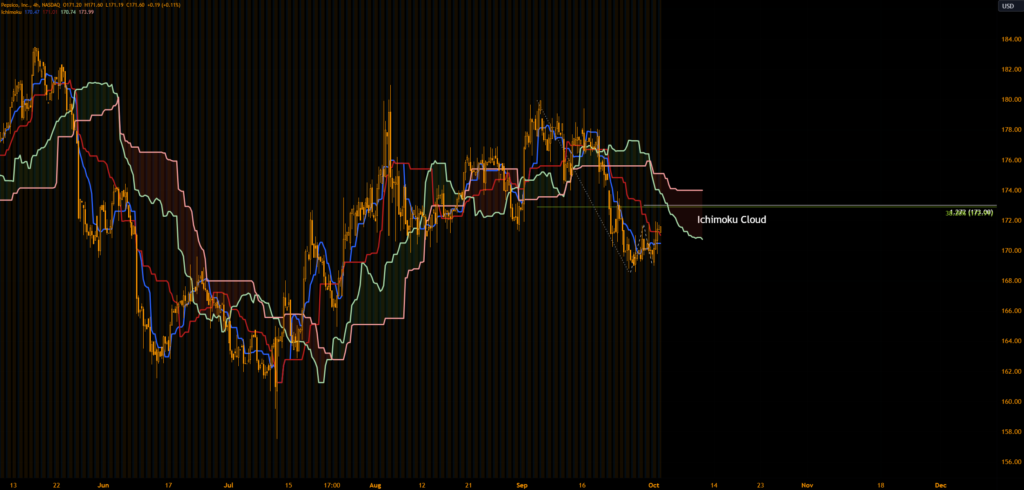
Pepsi’s stock price has recently crossed above both the Conversion Line (US$170.47) and Base Line (US$171.01) of the Ichimoku indicator, signaling potential bullish momentum. However, the looming Ichimoku Cloud presents a significant resistance zone between US$170.74 and US$173.99. This cloud not only represents psychological resistance but also coincides with key Fibonacci levels, particularly around US$173.00, where a Fibonacci cluster indicates a strong resistance area.

Price Dynamics and Investment Strategy:

Ahead of the earnings report, PepsiCo’s stock might test this resistance. Investors should watch for the stock’s ability to break through the Ichimoku Cloud, especially around the Fibonacci convergence at US$173.00. Given the slowed momentum since March, traders might consider tight risk management strategies, reducing positions to breakeven if the stock fails to push through this critical resistance.

Stay Ahead with PepsiCo’s Earnings:

Will PepsiCo break through the technical barriers, or will it succumb to the overhead cloud? Stay tuned for an insightful breakdown post-earnings to adjust your investment strategy in line with PepsiCo’s financial health and market trends.
PEPSI EARNINGS ICHIMOKU

Traders Watch S&P 500 for Key Support Levels

Traders SP 500

As traders gear up for the upcoming Federal Reserve rate announcement, all eyes are on the S&P 500, which recently notched a new record high at 5,670. Here’s what traders and investors are focusing on regarding the S&P 500’s key support levels:

Traders Watch S&P 500 for Key Support Levels
  • Market Context: The S&P 500’s recent performance has invalidated a bearish evening star pattern on its weekly chart, indicating strong bullish sentiment. However, with the market on tenterhooks for the Fed’s decision, attention shifts to critical support zones.
  • Key Support Analysis:
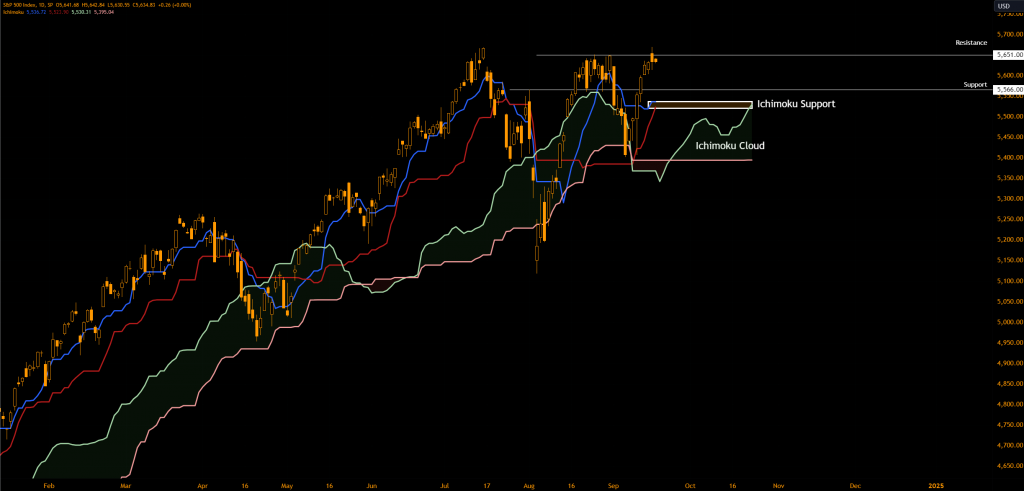
  • Immediate Support: Observers are keenly watching the 5,566 mark, which could serve as the first line of defense against any pullback.
  • Deeper Support Zones: Should the index dip below this level, the next significant support lies between 5,523 and 5,536, reinforced by Ichimoku indicators like the Conversion Line and the Base Line, along with the upper boundary of the Kumo Cloud.
  • Why These Levels Matter: These support levels are crucial for traders as they could dictate short-term market movements. A breach below these could signal a stronger correction, while holding above could reinforce the market’s bullish stance.
  • Market Sentiment from X: Discussions on platforms like X reflect a mix of caution and optimism, with traders ready to act on breaks of key levels or to capitalize on potential rebounds from these supports.
  • Looking Ahead: The focus remains on how the S&P 500 reacts post-Fed announcement. Will it maintain its ground above these key support levels, or will we see a test of lower supports? This is what traders watching the S&P 500 for key support levels are analyzing closely.

For those trading or investing in indices like the S&P 500, understanding these support levels can be crucial for strategy formulation, especially in volatile times driven by macroeconomic announcements. Keep these levels in your trading radar for informed decision-making.

SP 500 ICHIMOKU