PepsiCo Earnings October 2024

Unlocking PepsiCo’s Potential: Earnings Insight & Technical Analysis

As PepsiCo, Inc. (PEP) gears up to announce its earnings on October 8, 2024, investors and traders are keenly watching. With the market opening, all eyes are on whether PepsiCo will meet or exceed the consensus earnings per share (EPS) estimate of US$2.30, up from last year’s US$2.25 for the same fiscal quarter.

Unlocking PepsiCo's Potential: Earnings Insight & Technical Analysis

Navigating the Ichimoku Cloud:

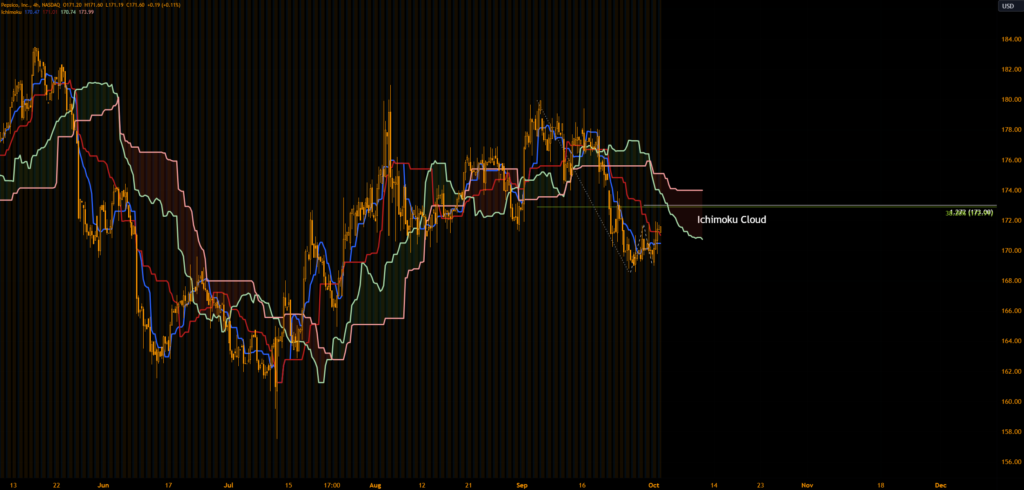
Pepsi’s stock price has recently crossed above both the Conversion Line (US$170.47) and Base Line (US$171.01) of the Ichimoku indicator, signaling potential bullish momentum. However, the looming Ichimoku Cloud presents a significant resistance zone between US$170.74 and US$173.99. This cloud not only represents psychological resistance but also coincides with key Fibonacci levels, particularly around US$173.00, where a Fibonacci cluster indicates a strong resistance area.

Price Dynamics and Investment Strategy:

Ahead of the earnings report, PepsiCo’s stock might test this resistance. Investors should watch for the stock’s ability to break through the Ichimoku Cloud, especially around the Fibonacci convergence at US$173.00. Given the slowed momentum since March, traders might consider tight risk management strategies, reducing positions to breakeven if the stock fails to push through this critical resistance.

Stay Ahead with PepsiCo’s Earnings:

Will PepsiCo break through the technical barriers, or will it succumb to the overhead cloud? Stay tuned for an insightful breakdown post-earnings to adjust your investment strategy in line with PepsiCo’s financial health and market trends.
PEPSI EARNINGS ICHIMOKU

Traders Watch S&P 500 for Key Support Levels

Traders SP 500

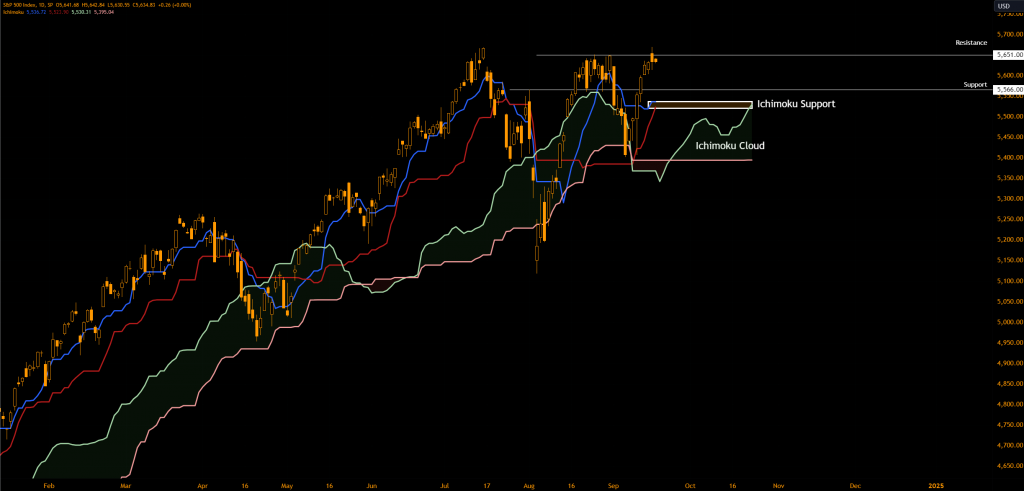
As traders gear up for the upcoming Federal Reserve rate announcement, all eyes are on the S&P 500, which recently notched a new record high at 5,670. Here’s what traders and investors are focusing on regarding the S&P 500’s key support levels:

Traders Watch S&P 500 for Key Support Levels
  • Market Context: The S&P 500’s recent performance has invalidated a bearish evening star pattern on its weekly chart, indicating strong bullish sentiment. However, with the market on tenterhooks for the Fed’s decision, attention shifts to critical support zones.
  • Key Support Analysis:
  • Immediate Support: Observers are keenly watching the 5,566 mark, which could serve as the first line of defense against any pullback.
  • Deeper Support Zones: Should the index dip below this level, the next significant support lies between 5,523 and 5,536, reinforced by Ichimoku indicators like the Conversion Line and the Base Line, along with the upper boundary of the Kumo Cloud.
  • Why These Levels Matter: These support levels are crucial for traders as they could dictate short-term market movements. A breach below these could signal a stronger correction, while holding above could reinforce the market’s bullish stance.
  • Market Sentiment from X: Discussions on platforms like X reflect a mix of caution and optimism, with traders ready to act on breaks of key levels or to capitalize on potential rebounds from these supports.
  • Looking Ahead: The focus remains on how the S&P 500 reacts post-Fed announcement. Will it maintain its ground above these key support levels, or will we see a test of lower supports? This is what traders watching the S&P 500 for key support levels are analyzing closely.

For those trading or investing in indices like the S&P 500, understanding these support levels can be crucial for strategy formulation, especially in volatile times driven by macroeconomic announcements. Keep these levels in your trading radar for informed decision-making.

SP 500 ICHIMOKU

BlackBerry’s Stock in Decline: A Closer Look Before Earnings

Is BlackBerry Facing a Continued Stock Decline? Here’s What Investors Should Know Before Earnings

BlackBerry’s Stock in Decline: A Closer Look Before Earnings

Is BlackBerry Facing a Continued Stock Decline? Here’s What Investors Should Know Before Earnings

As the tech sector braces for another round of earnings, BlackBerry Limited (BB) is under the spotlight with its earnings report due after the market closes on September 26, 2024. With analysts predicting an EPS of -$0.04 for the fiscal quarter ending August 2024, against last year’s -$0.06, the looming question is whether BlackBerry’s Stock in Decline: A Closer Look Before Earnings will reveal a turnaround or further descent.

BlackBerry's Stock in Decline: A Closer Look Before Earnings

Understanding BlackBerry’s Market Position

  • Earnings Expectations: The slight improvement in expected EPS might suggest a cautious optimism, but investors are keen to see if BlackBerry can capitalize on its strategic shifts towards cybersecurity and IoT.
  • Market Sentiment and Stock Performance: Recent discussions highlight a complex picture. On one hand, there’s an acknowledgment of a decline in stock value, with some investors debating the severity of this drop when viewed through different time lenses. On the other, there’s curiosity about whether this decline positions BlackBerry as an undervalued tech play, potentially at the cusp of a new growth cycle.

Technical Analysis Insights

  • Ichimoku Cloud and Trendlines:
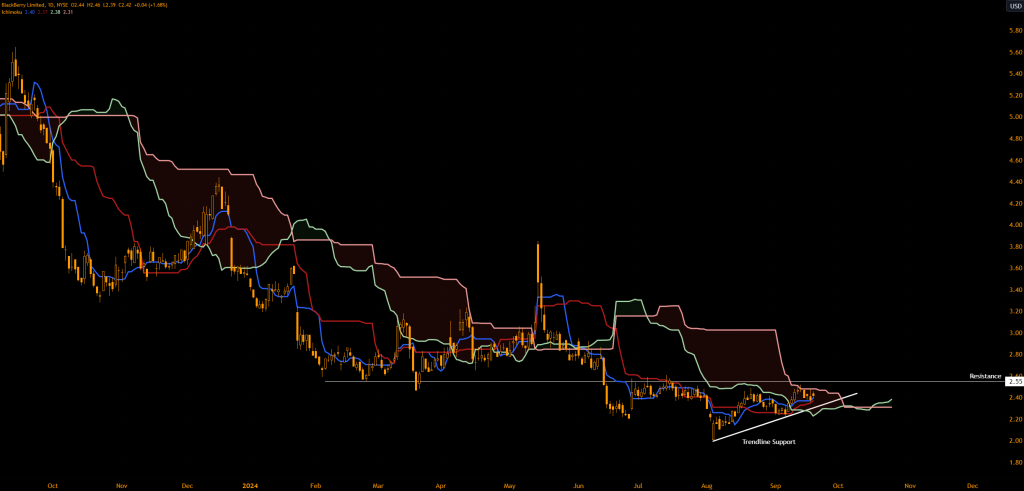
  • Current Price Action: After reaching a year-to-date low of $2.01 in early August, BlackBerry’s stock price has been testing the resilience of the Ichimoku Cloud’s upper boundary, suggesting areas where sellers might regroup.
  • Bullish and Bearish Signals: While the overarching trend shows lower highs and lows, suggesting a sell-on-rally approach, the Ichimoku indicators are sending mixed signals. The Conversion Line surpassing the Base Line could hint at underlying bullish momentum, although it’s juxtaposed with the stock’s struggle against key resistance levels at $2.55.
  • Resistance and Support Dynamics:
  • $2.55 Resistance: This level is critical. A break above could trigger short covering or indicate a shift in market sentiment. Conversely, failure to breach this could reinforce the downtrend.
  • Support Trendline: The ascending trendline from the low of $2.01 remains a pivotal line. A break below might signal to sellers that it’s time to increase positions or for new sellers to enter, potentially accelerating the decline.

Conclusion

As BlackBerry approaches its earnings date, the combination of fundamental analysis with technical indicators provides a nuanced view for investors. While the stock’s decline is evident, the mixed signals from the Ichimoku studies suggest that traders and long-term investors should closely watch post-earnings reactions for signs of either a rebound or a confirmed continuation of the downtrend.

For those looking to analyze BlackBerry’s stock before earnings, keeping an eye on these technical levels and understanding broader market sentiment will be key to navigating the potential volatility that earnings announcements often bring.

BlackBerry's Stock in Decline: A Closer Look Before Earnings

Understanding BTC/USD Fluctuations This Week: Is Bitcoin Set for Another Surge?

BTC/USD Up 50% This Year:

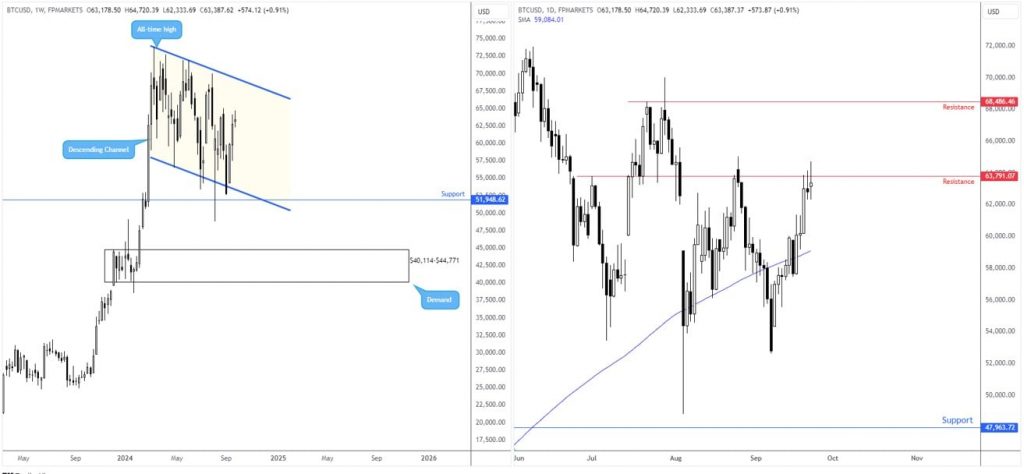
Bitcoin’s performance against the US dollar has been nothing short of stellar, with a year-to-date increase of over 50%, and a near 10% surge this month alone. This remarkable growth was particularly pronounced in the first quarter, where BTC/USD touched an unprecedented peak of $73,845. However, the subsequent price action has traced a descending channel, oscillating between this high and a lower boundary of $56,478, sparking debates among traders and analysts alike.

Bitcoin’s performance against the US dollar has been nothing short of stellar, with a year-to-date increase of over 50%, and a near 10% surge this month alone. This remarkable growth was particularly pronounced in the first quarter, where BTC/USD touched an unprecedented peak of $73,845. However, the subsequent price action has traced a descending channel, oscillating between this high and a lower boundary of $56,478, sparking debates among traders and analysts alike.

Is This Consolidation or a Warning Sign?

The current market dynamics have formed what technical analysts call a descending channel. This pattern raises a pivotal question: Are we witnessing a consolidation phase before Bitcoin embarks on another upward trajectory, or does this pattern signify underlying weakness, potentially leading to further declines?

Testing Key Resistance Levels

On a closer examination through the daily charts, BTC/USD is currently challenging a resistance level at $63,791. Despite some selling pressure at this juncture, the buying interest remains robust, especially after the price convincingly broke above the 200-day moving average, now around $59,085. This movement above the long-term trend indicator is often interpreted as a bullish signal, suggesting that the market sentiment might be shifting.

What’s Next for BTC/USD?

The weekly chart still provides ample room for upward movement toward the channel’s upper limit, hinting that a breakout above the daily resistance could be on the horizon. However, prudent traders might wait for additional confirmation signals, such as a successful retest of this resistance turned support or look for sustained price action above this level over several days to validate the breakout.

BTC/USD Up 50% This Year

Conclusion:
For those tracking the BTC/USD fluctuations this week, understanding these patterns and signals is crucial. Whether Bitcoin will continue to consolidate within this descending channel or break out to set new highs remains the focal point for investors and traders. Keep an eye on these key levels and indicators to navigate the volatile yet potentially rewarding landscape of Bitcoin trading against the US dollar.

Stay tuned for more real-time updates and expert analysis on BTC/USD to make informed decisions in this dynamic cryptocurrency market.