BTC/USD Up 50% This Year:
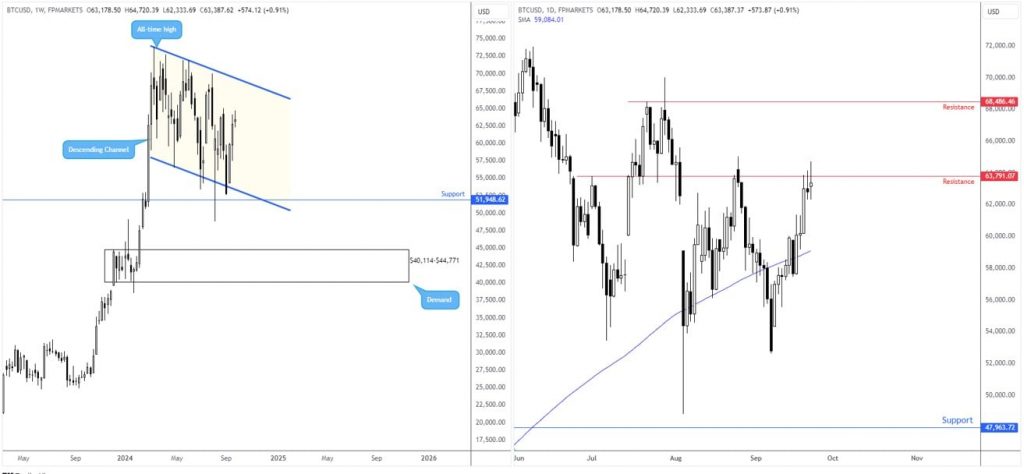
Bitcoin’s performance against the US dollar has been nothing short of stellar, with a year-to-date increase of over 50%, and a near 10% surge this month alone. This remarkable growth was particularly pronounced in the first quarter, where BTC/USD touched an unprecedented peak of $73,845. However, the subsequent price action has traced a descending channel, oscillating between this high and a lower boundary of $56,478, sparking debates among traders and analysts alike.

Bitcoin’s performance against the US dollar has been nothing short of stellar, with a year-to-date increase of over 50%, and a near 10% surge this month alone. This remarkable growth was particularly pronounced in the first quarter, where BTC/USD touched an unprecedented peak of $73,845. However, the subsequent price action has traced a descending channel, oscillating between this high and a lower boundary of $56,478, sparking debates among traders and analysts alike.
Is This Consolidation or a Warning Sign?
The current market dynamics have formed what technical analysts call a descending channel. This pattern raises a pivotal question: Are we witnessing a consolidation phase before Bitcoin embarks on another upward trajectory, or does this pattern signify underlying weakness, potentially leading to further declines?
Testing Key Resistance Levels
On a closer examination through the daily charts, BTC/USD is currently challenging a resistance level at $63,791. Despite some selling pressure at this juncture, the buying interest remains robust, especially after the price convincingly broke above the 200-day moving average, now around $59,085. This movement above the long-term trend indicator is often interpreted as a bullish signal, suggesting that the market sentiment might be shifting.
What’s Next for BTC/USD?
The weekly chart still provides ample room for upward movement toward the channel’s upper limit, hinting that a breakout above the daily resistance could be on the horizon. However, prudent traders might wait for additional confirmation signals, such as a successful retest of this resistance turned support or look for sustained price action above this level over several days to validate the breakout.

Conclusion:
For those tracking the BTC/USD fluctuations this week, understanding these patterns and signals is crucial. Whether Bitcoin will continue to consolidate within this descending channel or break out to set new highs remains the focal point for investors and traders. Keep an eye on these key levels and indicators to navigate the volatile yet potentially rewarding landscape of Bitcoin trading against the US dollar.
Stay tuned for more real-time updates and expert analysis on BTC/USD to make informed decisions in this dynamic cryptocurrency market.